ResearchDesk keeps a study together from the first project plan to the finished paper: team channels, tasks with owners, data and analysis on a canvas, reports that can be reproduced, and the writing itself. One place, one sign-in, your own server.
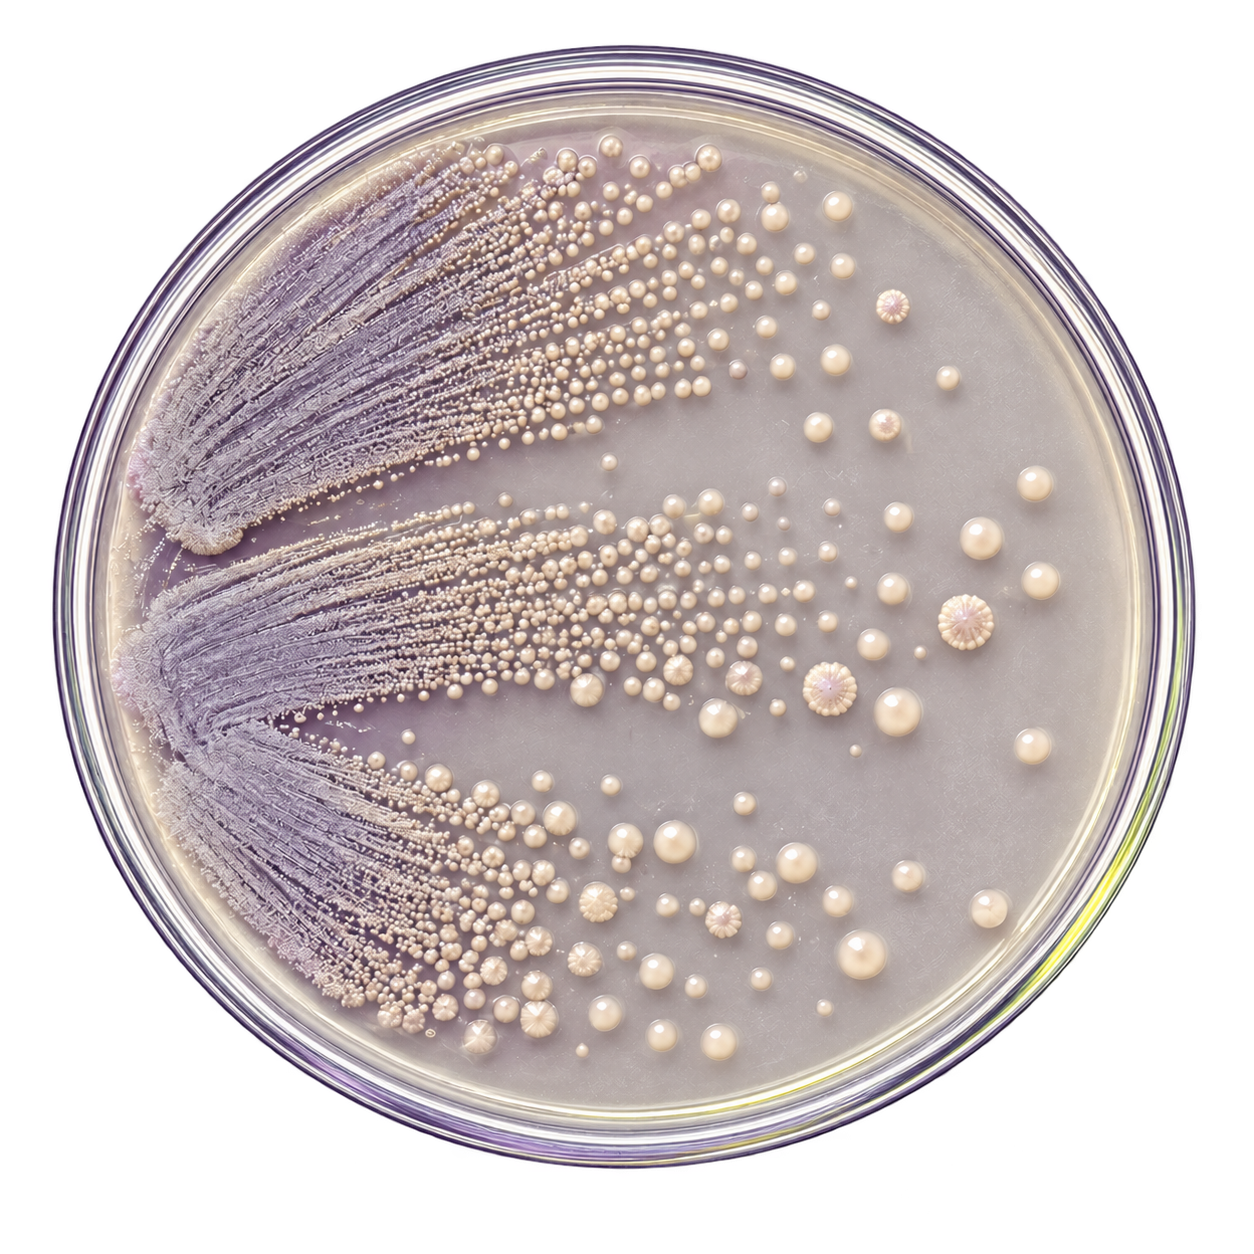
Example research conversations: Sofia marks colonies and shares her observation in a channel. In a structure discussion, Jonas asks for a PDB file, Sofia shares 4HHB, and Jonas rotates and annotates it. On the analysis canvas, the team builds an analysis and adds its figure to a report. Use the scene controls to explore each moment. These conversations and analysis results use demo data.
researchdesk# culture-study
JK
Jonas
Which colonies should we follow up?
SL
Sofia
I’ve marked three colonies for follow-up.
↗ culture-07.png · 3 marks
JK
Jonas
Thanks — let’s follow up on these.
JK
Jonas
Could you share the structure before we meet?
SL
Sofia
Here it is. Let’s look at chain A.
PDB 4HHB.pdb Open in 3D ↗
JK
Jonas
I’ve marked the region I mean. Can you see it?
SL
Sofia
Can we put the analysis and figures in one report?
JK
Jonas
I’ll connect the data on the canvas.
SL
Sofia
Great. The figure is in the report.
Message your group…
researchdesk4HHB.pdb
ABCD
researchdeskFlows & reports
Build an analysis. Create a report.Connect data, code and figures on the canvas.study = join(samples, abundance) stacked_bars(study, by="sample")See the canvas ↗
Sofia
Example collaboration
The platform
The whole study, in one app.
Most teams run a study across a chat tool, a task board, a shared drive, notebooks and a word processor. ResearchDesk is one workspace for all of it, so nothing has to be copied from one place to the next.
Plan
Projects with milestones, a people directory, seminars and a task board with owners and due dates. List or board, per project or for the whole group.
Projects · Tasks · People · Seminars
Discuss
Channels for every project, public or private, with threads, mentions, reactions and files. A message becomes a task with one click, and the decision stays with the conversation.
Upload data into a study and explore it in flows: a canvas per question, with tables, code steps or ready kits, and every figure and number a step produces. Describe a step in plain words and the assistant drafts the code.
Compose reports from the outputs of any flow: figures, tables, numbers and findings on a page. Share with named colleagues or by link. Readers see the results and their provenance, never the raw data.
Draft the manuscript in the same workspace: figures and tables from your reports, references from your library, comments and review from the group, a history of every change.
Writer · References · Review · History
One thread runs through all five: a result on a report page knows the flow, the step, the code version and the run it came from, the task that asked for it, and the channel where it was discussed. Sign in once with your institution's account; the whole team works in the same place, in the browser or in the Mac app.
In practice
The same app, two moments in a day.
In the morning the group talks a result through in a channel and someone takes the next step as a task. In the afternoon the analysis runs on the canvas and its figure lands in the report. Same app, same people.
Three example research conversations: Sofia rotates and annotates the 4HHB protein structure; Sam follows a dilution series and updates a colony count; Alex marks a region on a shared figure. Each thread includes a colleague’s reply before the next conversation opens. Choose a thread or pause below.
Example Flow workflow: bring sample data and metadata together on an analysis canvas, add a figure to the report, then read the same results alongside a comparison table and explanation. Choose Canvas or Report, or pause the animation below.
Flow canvasExample study
Bring sample data and metadata into your analysis.
Figures, tables and the explanation, in one report.
Example study · Canvas → report
AI, hosted where you trust it
Libraries were prepared from 50 ng input DNA with the Nextera XT kit and quantified by Qubit dsDNA HS assay.
Alpha diversity did not differ between groups (Wilcoxon, p = 0.42), whereas composition did (PERMANOVA, R² = 0.08).
The assistant is part of the app, and it talks to whatever language model you decide to trust: a model your institution hosts, an endpoint like Blablador, or the open-weight models we host in Germany under GDPR. It explains a code step in plain words, writes a step from a sentence, repairs a failed run from its error and drafts the narrative of a flow. Everything it writes is a labelled version you can read, run and undo.
Example: on the flow canvas, the assistant adds a code step, connects it to the samples, runs it, and places the resulting figure. A bioinformatician checks the run.
researchdeskFlow canvas · Assistant
The assistant is looking at the samples…
Inside the chat
The science stays in the conversation.
Ten small tools live in every channel, so a calculation, a sequence or a structure can be shared and discussed where the question came up, not exported to another program. Each one keeps its inputs with the message.
Groups that sequence get the whole study lifecycle inside ResearchDesk: from the sequencing request to the pipeline run to the shared result, on your own compute.
Study and sample management
Create a sequencing request, collect the sample metadata and pick the technology your facility has configured, from Illumina and Nanopore to PacBio and MGI devices. Public reads from ENA and benchmark sets like CAMI come in with their source metadata.
Pipelines on your infrastructure
Run Nextflow pipelines from a curated catalogue, follow their progress and keep every output connected to the samples it came from. Add the pipelines your research needs.
From run to report
Pipeline outputs land as tables and figures in the study, ready for a flow on the canvas and for the report, with the same provenance as everything else.
For facilities and groups
One command installs it on a server your IT team agrees on. Facilities take orders from their groups; groups see their studies, runs and results in the same app they plan and write in.
Figure→Report→Flow→Step, version 4→Run EXP-0142→Table growth-assay
01
Steps are code with versionsEvery step on the canvas is a script or a kit with parameters. Each change is a new version, whether a person or the assistant wrote it, and each run records which version it used.
02
Outputs stay linkedFigures, tables, numbers and written findings are outputs of a run. A report block points at the output, so the page follows the analysis when it is rerun, and says so when the code moved on.
03
Readers see results, not dataShare a report with named colleagues, who sign in with their institution's account, or by link. They get the live page with the provenance of every result; uploaded tables stay out unless you allow it.
04
Nothing runs by itselfThe assistant proposes; people press Run. Descriptions written from code carry a mark and are flagged when the code changes.
Autopilot
Automated analysis, with a human in the loop.
01
You brief the studySamples, metadata and the question, in a study.
02
Autopilot runs itPlans the pipelines, runs them on your compute, drafts the figures.
03
A bioinformatician signs offChecks the run, advises on the results, and you get the report.
The AI runs your analysis on the canvas. A trained bioinformatician oversees every run, checks the results and advises you on what they mean.
A human in the loop
With ResearchDesk you get oversight from an experienced bioinformatician. On request they advise you on the analysis, and carry out the study with Autopilot. Because the pipelines are modular and the routine work is automated, it takes a fraction of the bioinformatician time a traditional analysis needs.
Someone experienced checks the work
Every report the assistant produces is reviewed by an experienced bioinformatician before it reaches you: they check that the run did what the study asked, that the figures show what they claim, and that the numbers hold. If something is off, it goes back before it goes out.
About ResearchDesk
Built around research groups.
Running a research group means keeping track of people, projects, deadlines, data and the writing, and that work usually ends up spread across a chat tool, spreadsheets, folders, notebooks and a word processor.
ResearchDesk is one application for all of it, developed at the Helmholtz Centre for Infection Research and run on your own server or in Helmholtz Cloud. Coordination, analysis and writing share one workspace and one sign-in, so a result can be traced from the paper back to the data, and the people who produced it are one message away.
Request free access to the HZI-hosted ResearchDesk workspace for your research group. We’ll confirm eligibility and help you get started. The self-hosted setup offer includes the first year free, hosted in Helmholtz Cloud; contact us to discuss that package.